|
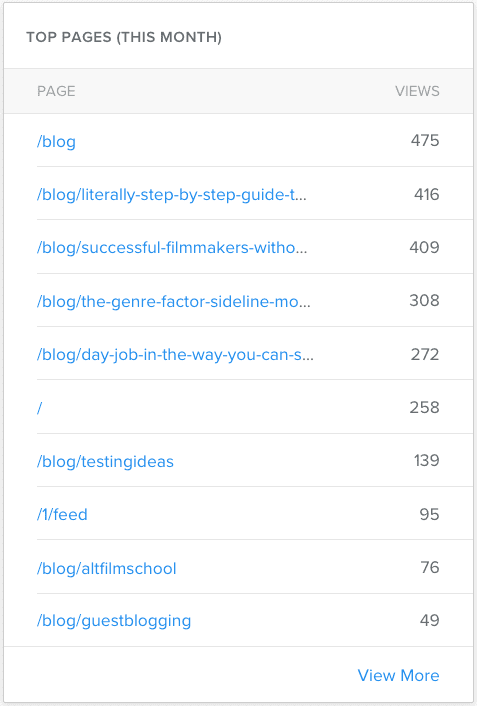
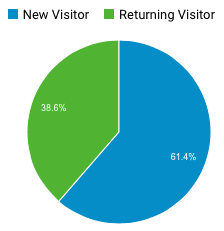
The year 2016 has been full of changes. This was big for our production company, Sideline Pictures. We released a feature film and have started new initiatives in the last few months to grow our audience. As an online marketer and content creator myself, I have been watching over our statistics to see what lessons I could learn from this experimentation stage in Sideline Pictures. In this post, I am going to go through the last three months of the Sideline Pictures website growth and related social media channels. Those are my primary responsibility and what I do for other businesses, so they are of the most interest to me (and probably you). Website BlogAt the beginning of December, we started posting to the blog a few times a week. This content was primarily informational and is intended to help our target audience of other filmmakers. The goal here is to increase authority and network reach. Also helping people makes us feel all warm and fuzzy inside. Unique visitors to the site started to spike immediately after new content was being created. Not only did this give visitors more potential pages to land on, it also opened up new opportunities to share pages on social media. 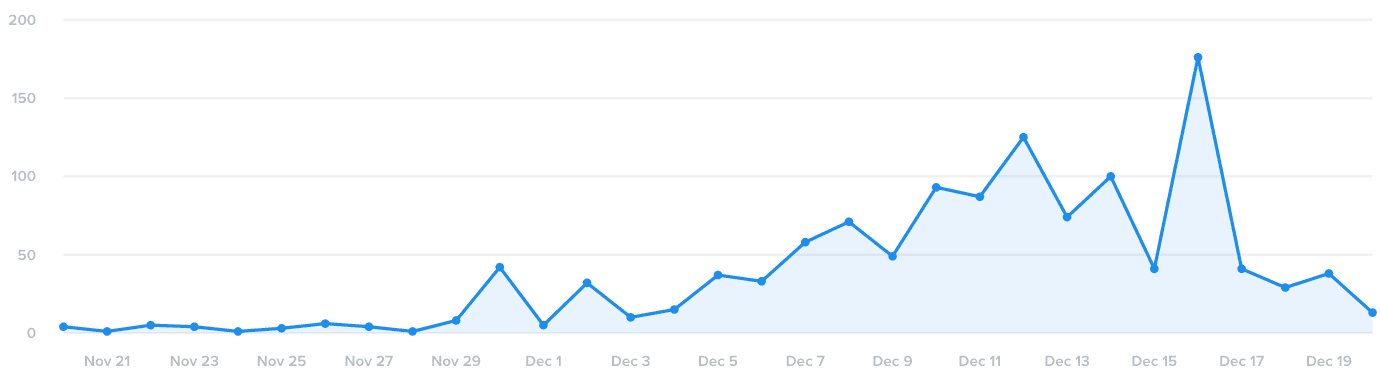 Weebly Unique Visitors 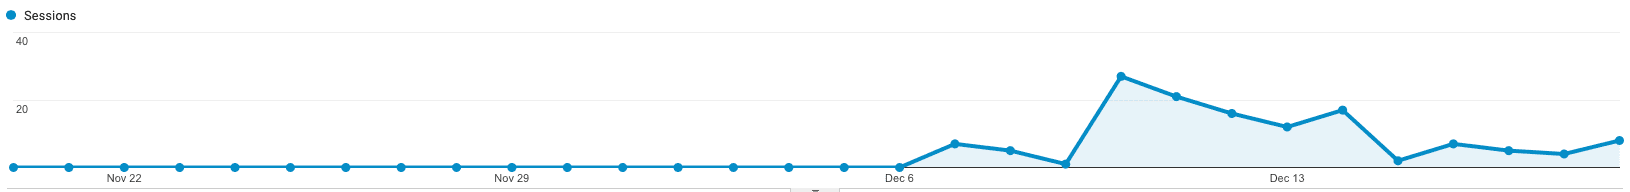 Google Analytics Sessions The blog leaped well ahead of the home page during this time. The returning visitors that Google Analytics tracks also increased from about 25% previously to 38%. That's a good sign that new visitors are coming back when they see new blogs being posted.
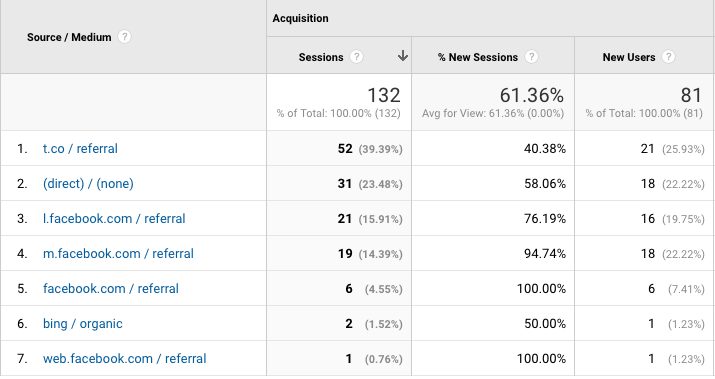
Another metric that we will start tracking through future months is the "Page Depth" through Google Analytics. This metric shows how many additional pages these visitors are viewing. More pages per visitor is encouraging because that means they are going on to read other blog posts after the one they came to the site for. 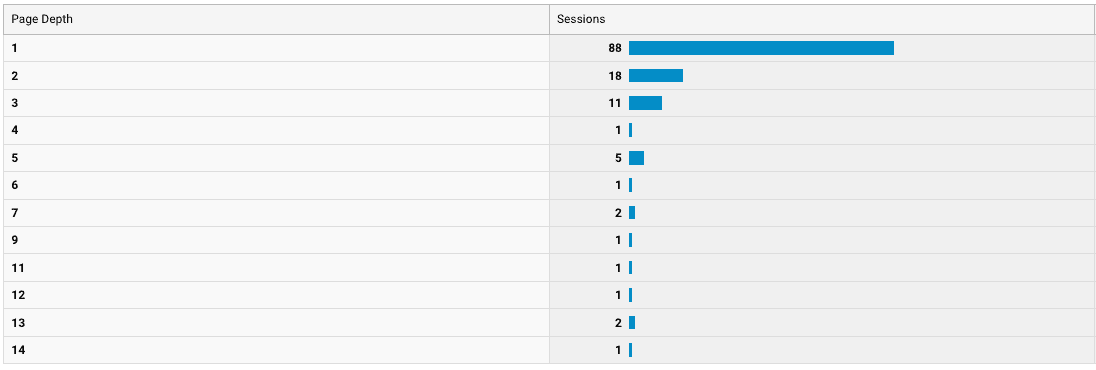 Google Analytics Page Depth According to Weebly's analytics, the highest source of traffic to the site was from Facebook by far. Google Analytics shows a different story, with Twitter (t.co) leading the traffic.
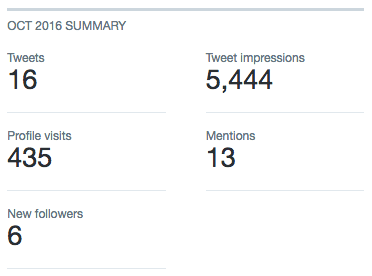
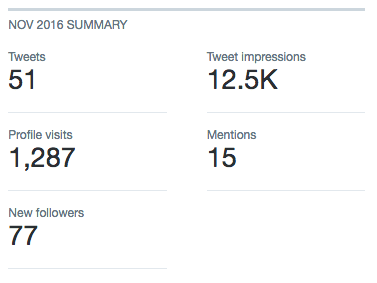
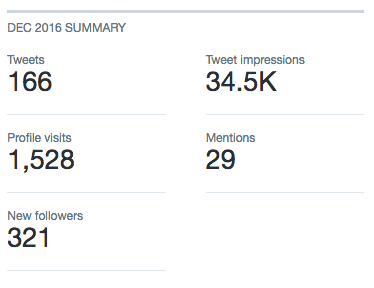
The discrepancies between Google Analytics and Weebly Analytics are always due to the way they capture the data. Weebly uses IP Addresses to tally up visits, while Google uses cookies. So Weebly will be a bit higher than the real numbers due to bots being counted. Google will be considerably lower than the real numbers due to the amount of people with cookies disabled. Social MediaFacebook's traffic almost all came from the Filmmaker's Process group page post that Robert Hardy was kind enough to post. The fan page was not successful in any way when driving traffic or getting impressions. The second big change over the last few months has been the amount of Twitter posts we have used. More time was spent on Twitter and the results show the benefits. Increases across the board over the last 28 days are promising. The increased rate of posting and engaging contributed to this growth. 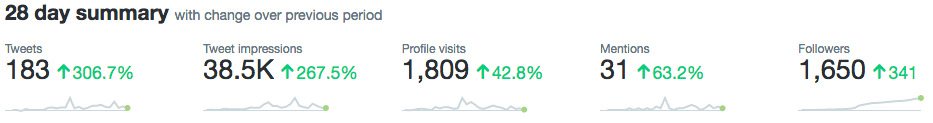 Twitter Change Over Time Participating in #FilmCurious chat resulted in huge spikes that can be seen on the graphs. In November, we increased the number of tweets dramatically and saw positive results. We did this again in December and those results multiplied. The impressions per tweet starts to drop with more tweets per month. October had an average 340 impressions per tweet. November had an average 245 impressions per tweet. December had an average 207 impressions per tweet.
Despite a drop in impressions per tweet, the overall impressions increase dramatically. The profile visits, mentions, and new followers also increase dramatically. The simple takeaway: More activity encourages more activity. Posting more often increases opportunities to be seen. Being seen increases opportunities for engagement. Engaging increases the relationship with individual followers or non-following members. This comes full circle when considering the statistical increase when new content appears on social media. A lot can be chalked up to Facebook group posts (still an incredibly effective way of getting content out there). Twitter averaged out to about a visitor per tweet. Facebook posts to the fan page was essentially useless due to a smaller audience there. SuccessProducing helpful content through blogging, podcasting, or high-quality videos brought significant returns in the way of engagement and social authority. Those are important factors to growing online. The future will tell how well these pieces of content continue to bring in visitors months after they are produced. Room For ImprovementThe key area here that can improve is Facebook. Taking advantage of more Facebook Group posting and actively promoting the fan page will drive more visitors to the site. The Facebook Groups are already the most effective source of traffic, so it will be worth increasing efforts in that arena. Also, the #FilmCurious Twitter chat is very rewarding to participate in. Another area for improvement would be finding additional relevant Twitter chats to participate in throughout the month. If you're looking for someone to manage your online presence and see promise in these results, we would love to work with you!
1 Comment
|
PopularCategories
All
|

 RSS Feed